What Does Facebook Advertising Cost in 2025?
Facebook advertising costs vary significantly based on industry, targeting, and campaign objectives. On average, businesses pay $0.97 to $1.84 per click, $7.19 to $14.40 per 1,000 impressions, and $5.47 to $18.68 per conversion. These costs fluctuate based on audience competition, ad quality, timing, and geographic targeting, making Facebook one of the most cost-effective social media advertising platforms available today.
| Metric | Average Cost Range | Best Case Scenario | Competitive Industries |
|---|---|---|---|
| Cost Per Click (CPC) | $0.97 – $1.84 | $0.45 – $0.80 | $2.50 – $5.00+ |
| Cost Per 1000 Impressions (CPM) | $7.19 – $14.40 | $4.00 – $8.00 | $15.00 – $30.00+ |
| Cost Per Action (CPA) | $5.47 – $18.68 | $2.50 – $8.00 | $25.00 – $75.00+ |
| Cost Per Lead (CPL) | $3.50 – $12.00 | $1.50 – $5.00 | $15.00 – $40.00+ |
Understanding Facebook Advertising Cost Structure
Facebook advertising operates on a sophisticated auction-based system where advertisers compete for ad placement in users’ feeds, stories, and other placements. Unlike traditional advertising mediums with fixed pricing, Facebook advertising cost fluctuates in real-time based on supply and demand dynamics.
The platform’s algorithm considers multiple factors when determining ad costs, including bid amount, estimated action rates, and ad quality scores. This means that higher-quality ads often achieve lower costs per result, rewarding advertisers who create engaging, relevant content for their target audiences.
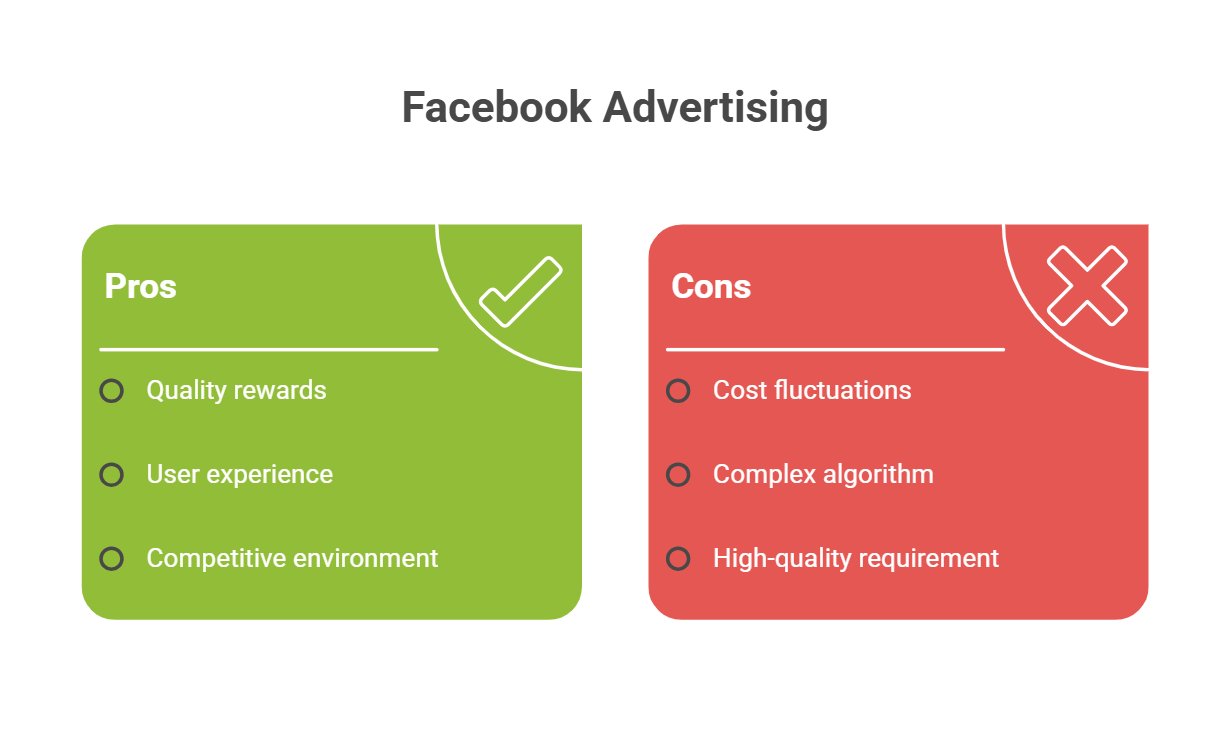
Facebook’s pricing structure is designed to maximize both advertiser satisfaction and user experience. The platform prioritizes ads that generate meaningful interactions and positive user responses, which creates a competitive environment where quality content naturally achieves better cost efficiency. This approach differs significantly from traditional advertising channels where premium placement simply goes to the highest bidder regardless of content quality.
Facebook Advertising Pricing Models
• Cost Per Click (CPC): You pay when users click on your ad.
• Cost Per Mille (CPM): You pay for every 1,000 impressions your ad receives.
• Cost Per Action (CPA): You pay when users complete specific actions like purchases or sign-ups.
• Cost Per Lead (CPL): You pay for each qualified lead generated through your ads.
• Video View Costs: Specialized pricing for video engagement campaigns.
When comparing social media advertising cost across platforms, Facebook consistently demonstrates superior targeting capabilities and audience reach, making it a cornerstone of most digital marketing strategies.
Detailed Facebook Advertising Cost Breakdown by Industry
Industry-specific variations in Facebook advertising cost reflect different levels of competition, audience demand, and conversion values. Understanding these variations helps set realistic budget expectations and identify opportunities within your market sector.
| Industry | Average CPC | Average CPM | Average CPA | Competition Level |
|---|---|---|---|---|
| E-commerce / Retail | $0.70 – $1.20 | $5.50 – $9.00 | $4.00 – $12.00 | Medium |
| Finance / Insurance | $3.77 – $6.50 | $18.00 – $35.00 | $40.00 – $85.00 | Very High |
| Real Estate | $1.81 – $3.40 | $12.00 – $22.00 | $18.00 – $45.00 | High |
| Healthcare | $1.32 – $2.80 | $8.50 – $16.00 | $12.00 – $30.00 | High |
| Technology / Software | $1.89 – $4.20 | $11.00 – $25.00 | $22.00 – $55.00 | High |
| Food & Beverage | $0.85 – $1.60 | $6.00 – $11.00 | $8.00 – $18.00 | Medium |
| Travel & Hospitality | $0.90 – $1.75 | $7.00 – $13.00 | $6.50 – $20.00 | Medium |
| Education | $1.06 – $2.30 | $8.00 – $15.00 | $15.00 – $35.00 | Medium-High |
Key Factors Influencing Facebook Advertising Cost
Understanding the variables that impact Facebook advertising cost enables strategic budget management and campaign optimization. These factors interact dynamically, creating opportunities for cost reduction through strategic planning and execution.
Audience Targeting and Demographics
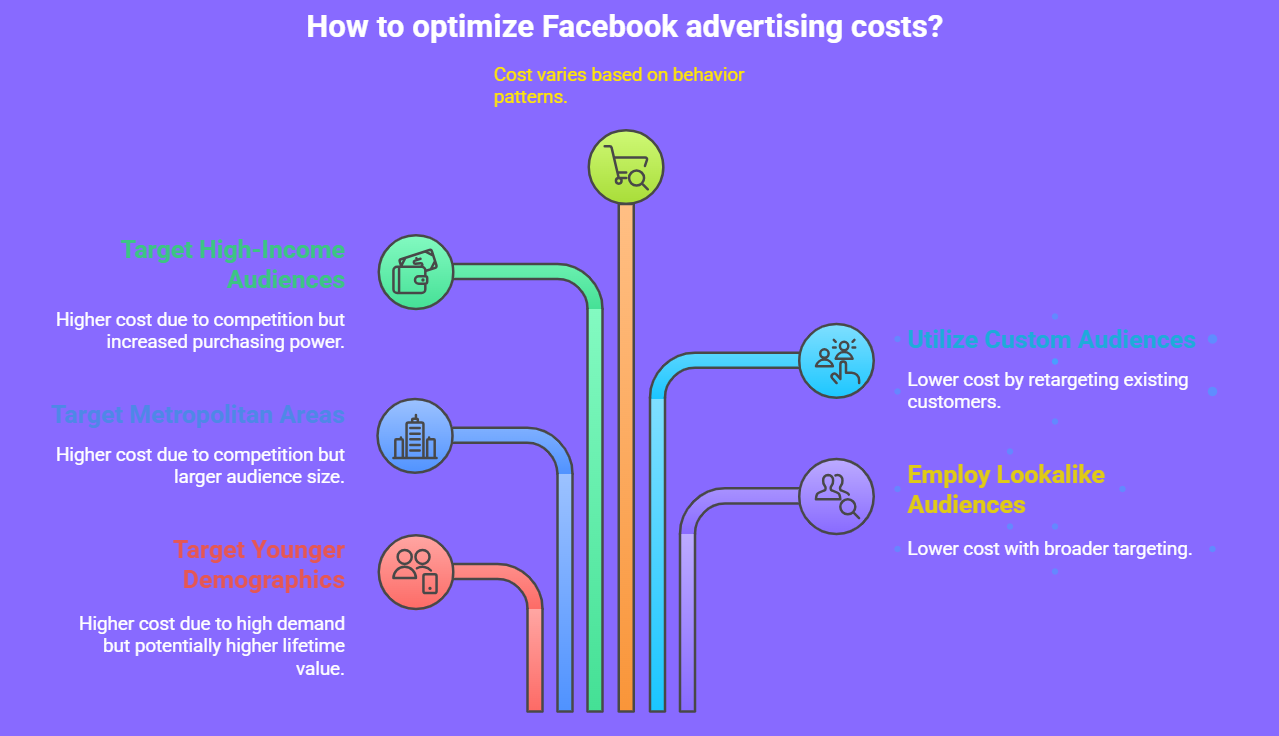
The demographic composition of your target audience plays a crucial role in determining Facebook advertising cost. Younger demographics, particularly those aged 18-34, consistently command higher advertising prices due to their perceived higher lifetime value and purchasing power. This demographic group represents the sweet spot for most consumer brands, creating intense competition among advertisers.
Geographic targeting significantly influences pricing structures across Facebook’s advertising platform. Major metropolitan areas like New York, Los Angeles, and San Francisco typically require higher bids due to increased competition and higher cost of living. Conversely, rural markets often offer cost advantages, though they may provide smaller audience sizes and different consumer behaviors.
• Age and Gender: Younger demographics (18-34) typically cost more due to higher advertiser demand.
• Geographic Location: Major metropolitan areas command premium prices compared to rural regions.
• Income Level: High-income audiences often require higher bids due to increased competition.
• Interest Targeting: Niche interests may cost more but often deliver better conversion rates.
• Behavioral Targeting: Purchase behavior and device usage patterns affect pricing.
• Custom Audiences: Retargeting existing customers usually costs less than acquiring new ones.
• Lookalike Audiences: Broader lookalike percentages generally cost less but may be less targeted.
Campaign Objectives and Optimization Goals
• Brand Awareness: Typically the lowest cost per impression but limited conversion tracking.
• Traffic Generation: Moderate costs with focus on driving website visits.
• Lead Generation: Higher costs but often better lead quality and conversion rates.
• Conversions: Premium pricing but optimized for actual business results.
• App Installs: Varies significantly based on app category and target demographics.
• Video Views: Cost-effective for engagement but requires compelling creative content.
• Store Visits: Location-based campaigns with varying costs by geographic market.
Ad Quality and Relevance Factors
Facebook’s algorithm rewards high-quality advertisements with lower costs through its relevance scoring system. Ads that generate positive user engagement receive preferential treatment in the auction process, directly impacting your advertising expenses.
The platform’s quality assessment considers multiple engagement signals to determine ad relevance and user satisfaction. High-performing ads typically achieve better reach and lower costs because they align with Facebook’s goal of maintaining positive user experience. This creates a virtuous cycle where better content leads to lower costs and improved campaign performance.
Creative quality extends beyond visual appeal to include messaging relevance, timing appropriateness, and audience alignment. Ads that feel native to the platform and provide genuine value to users consistently outperform overtly promotional content in both engagement rates and cost efficiency.
• Click-Through Rate (CTR): Higher CTR indicates relevant content and reduces costs.
• Engagement Rate: Likes, shares, and comments signal quality content to Facebook’s algorithm.
• Conversion Rate: Strong conversion performance improves ad delivery and reduces costs.
• Creative Quality: Professional visuals and compelling copy improve user engagement.
• Landing Page Experience: Fast-loading, mobile-optimized pages reduce advertising costs.
• Ad Frequency: Overexposure to the same audience increases costs due to ad fatigue.
Comprehensive Social Media Advertising Cost Comparison
Understanding how Facebook advertising cost compares to other social media platforms helps optimize budget allocation across different channels. Each platform offers unique advantages and cost structures suited to specific marketing objectives.
The social media advertising landscape presents a diverse ecosystem where each platform has developed distinct pricing models and audience characteristics. While Facebook often provides the most comprehensive targeting options, other platforms may offer better value for specific demographics or content types.
Platform selection should be based on audience alignment and campaign objectives rather than solely on cost considerations. A higher-cost platform that delivers better-qualified leads or higher conversion rates often provides superior return on investment compared to lower-cost alternatives with poor audience fit.
| Platform | Average CPC | Average CPM | Typical Audience | Best Use Cases |
|---|---|---|---|---|
| $0.97 – $1.84 | $7.19 – $14.40 | Broad demographics | Brand awareness, lead generation | |
| $1.20 – $2.50 | $8.50 – $16.00 | 18-34 age group | Visual products, lifestyle brands | |
| $5.26 – $8.00 | $6.59 – $12.00 | B2B professionals | Lead generation, recruitment | |
| $0.38 – $2.00 | $6.46 – $15.00 | News-conscious users | Real-time engagement, customer service | |
| TikTok | $1.00 – $2.50 | $10.00 – $20.00 | Gen Z, millennials | Viral content, brand awareness |
| YouTube | $0.10 – $0.30 | $4.00 – $8.00 | Video consumers | Product demos, tutorials |
| $0.20 – $1.50 | $2.00 – $5.00 | Female-skewed audience | E-commerce, lifestyle products |
Platform-Specific Advantages for Cost Optimization
Facebook Advantages: • Mature advertising ecosystem with extensive targeting options • Large user base across multiple age demographics
• Advanced pixel tracking and conversion optimization • Multiple ad formats and placement options • Robust audience insights and analytics tools
When Other Platforms May Offer Better Value: • LinkedIn for high-value B2B lead generation despite higher costs • TikTok for reaching Gen Z audiences with viral content potential • YouTube for educational content and product demonstrations • Pinterest for lifestyle and e-commerce brands targeting female consumers
Advanced Strategies to Reduce Facebook Advertising Cost
Implementing sophisticated optimization strategies can significantly reduce Facebook advertising cost while maintaining or improving campaign performance. These tactics require ongoing testing and refinement but deliver substantial long-term savings.
The key to successful cost optimization lies in understanding that Facebook’s algorithm rewards advertisers who provide value to users. Rather than trying to game the system, focus on creating genuinely engaging content that resonates with your target audience. This approach naturally leads to improved performance metrics and reduced advertising costs over time.
Audience Research and Segmentation Techniques
• Create Detailed Buyer Personas: Develop comprehensive profiles based on customer data analysis.
• Use Facebook Audience Insights: Analyze demographics, interests, and behaviors of your target market.
• Implement Exclusion Targeting: Remove audiences unlikely to convert to reduce wasted spend.
• Test Audience Size: Compare narrow vs. broad targeting to find optimal cost-performance balance.
• Leverage Customer Data: Upload customer lists for precise targeting and lookalike audience creation.
• Monitor Audience Overlap: Avoid competing against yourself by identifying overlapping audiences.
• Seasonal Audience Adjustments: Modify targeting based on seasonal buying patterns and behaviors.
Creative Optimization and A/B Testing
• Test Multiple Ad Formats: Compare single image, carousel, video, and collection ads.
• Experiment with Headlines: Test emotional vs. rational appeals in ad headlines.
• Optimize Visual Elements: Compare product shots, lifestyle images, and user-generated content.
• Refine Call-to-Action Buttons: Test different CTA options to improve click-through rates.
• Create Video Variations: Test different video lengths, styles, and messaging approaches.
• Implement Dynamic Creative: Let Facebook automatically test creative combinations.
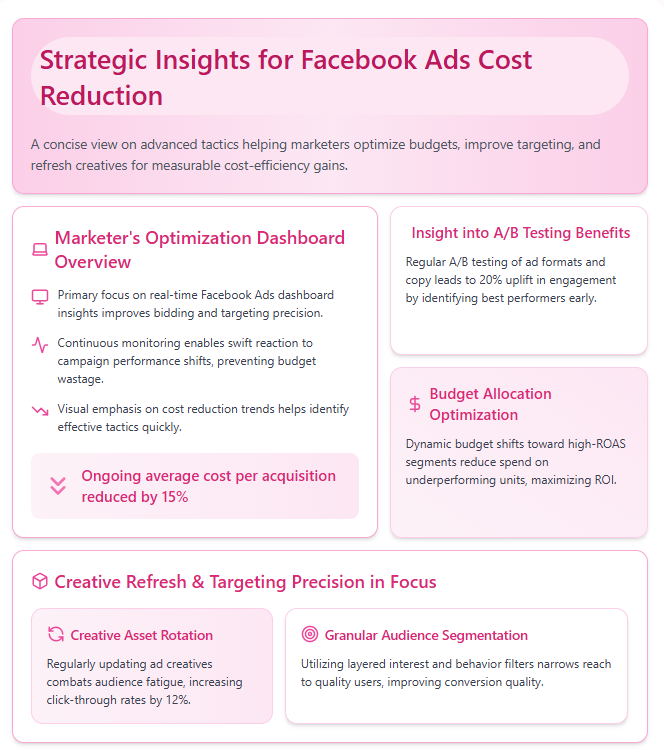
• Regular Creative Refresh: Replace ad creative every 2-3 weeks to combat ad fatigue.
Bidding and Budget Optimization
Understanding Facebook’s bidding system enables more precise cost control and improved campaign performance. Strategic bidding approaches can significantly impact your overall advertising expenses.
• Start with Automatic Bidding: Allow Facebook to optimize bids based on campaign objectives.
• Graduate to Manual Bidding: Implement bid caps or target costs for greater control.
• Use Cost Caps Strategically: Set maximum acceptable cost per action to control spending.
• Implement Bid Strategies by Funnel Stage: Use different bidding approaches for awareness vs. conversion campaigns.
• Monitor Auction Competition: Adjust bids based on competitive landscape changes.
• Schedule Budget Delivery: Use ad scheduling to focus spending during peak performance hours.
• Implement Campaign Budget Optimization: Allow Facebook to allocate budget across ad sets automatically.
Budget Planning and Management Frameworks
Effective budget planning creates predictability in Facebook advertising cost while maximizing return on investment. Structured approaches to budget allocation enable better performance tracking and optimization opportunities.
Budget Allocation Strategies
• 70-20-10 Rule: Allocate 70% to proven campaigns, 20% to optimization, 10% to testing.
• Funnel-Based Budgeting: Distribute spending across awareness, consideration, and conversion stages.
• Seasonal Budget Planning: Increase spending during peak seasons, reduce during slower periods.
• Performance-Based Allocation: Shift budget toward highest-performing campaigns and audiences.
• Geographic Budget Distribution: Allocate spending based on market potential and competition levels.
• Product-Based Budgeting: Distribute budget according to profit margins and sales velocity.
• Competitive Response Budgeting: Adjust spending based on competitor activity and market conditions.
Performance Monitoring and KPI Framework
| KPI Category | Primary Metrics | Target Ranges | Optimization Actions |
|---|---|---|---|
| Cost Efficiency | CPC, CPM, CPA | Industry benchmarks | Bid adjustments, audience refinement |
| Engagement | CTR, Engagement Rate | >1% CTR, >3% Engagement | Creative optimization, audience testing |
| Conversion | ROAS, Conversion Rate | >4:1 ROAS, >2% CR | Landing page optimization, offer testing |
| Audience Quality | Cost per Lead, LTV | <$20 CPL, >$200 LTV | Targeting refinement, qualification process |
Advanced Facebook Advertising Cost Analysis
Deep analysis of advertising performance requires understanding complex relationships between cost factors and business outcomes. Sophisticated measurement approaches reveal optimization opportunities often missed by surface-level metrics.
Attribution and Tracking Sophistication
• Multi-Touch Attribution: Track customer interactions across multiple touchpoints before conversion.
• Cross-Device Tracking: Understand how users interact with ads across different devices.
• Lifetime Value Analysis: Calculate long-term customer value to justify higher acquisition costs.
• Incremental Lift Testing: Measure true advertising impact through controlled experiments.
• Custom Conversion Tracking: Set up specific conversion events aligned with business objectives.
• Offline Conversion Tracking: Connect online ads to offline sales and store visits.
• View-Through Conversion Analysis: Understand the impact of ad impressions even without clicks.
Market Dynamics and Competitive Intelligence
Understanding broader market conditions helps predict Facebook advertising cost fluctuations and identify strategic opportunities for budget optimization.
• Seasonal Cost Patterns: Analyze historical data to predict cost increases during peak periods.
• Competitive Analysis: Monitor competitor ad activity and adjust strategies accordingly.
• Market Saturation Assessment: Evaluate audience saturation levels in your target markets.
• Economic Impact Considerations: Understand how economic conditions affect advertising costs.
• Platform Algorithm Changes: Stay informed about Facebook algorithm updates affecting costs.
• Industry Trend Analysis: Track emerging trends that might impact advertising effectiveness.
• Geographic Market Variations: Analyze cost differences across different geographic markets.
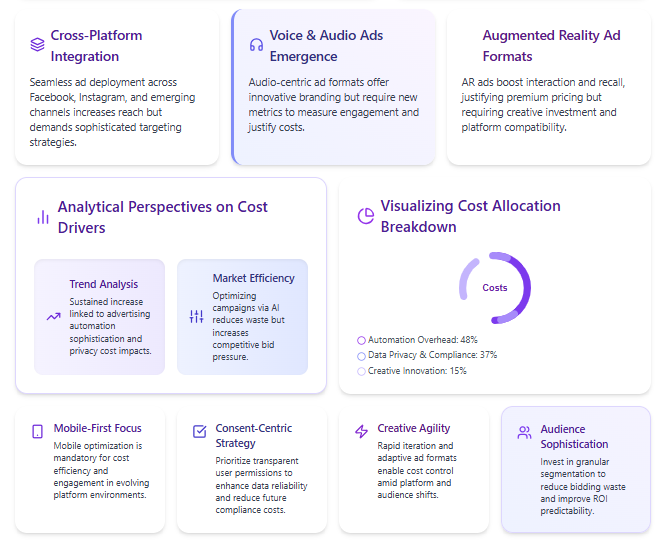
Future Trends in Facebook Advertising Cost
The evolving digital advertising landscape presents both challenges and opportunities for managing Facebook advertising cost. Understanding emerging trends enables proactive strategy adjustments and long-term budget planning.
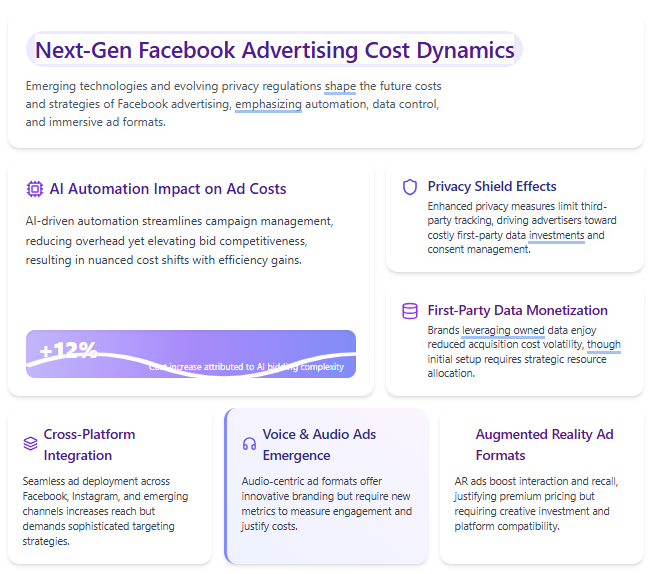
Technology and Privacy Developments
• iOS 14.5+ Impact: Continued effects of Apple’s privacy changes on targeting and costs.
• First-Party Data Emphasis: Increased importance of owned customer data for targeting.
• AI and Machine Learning: Enhanced automation potentially improving cost efficiency.
• Privacy-First Advertising: Development of new targeting methods respecting user privacy.
• Cross-Platform Integration: Improved tracking across Meta’s family of apps.
• Augmented Reality Advertising: New ad formats potentially affecting cost structures.
• Voice and Audio Advertising: Emerging formats creating new cost considerations.
Market Evolution Predictions
Industry experts predict several trends that may significantly impact Facebook advertising cost over the next 2-3 years, requiring strategic preparation and budget flexibility.
• Increased Competition: More businesses adopting Facebook advertising may drive up costs .
• Niche Market Opportunities: Specialized targeting options may create cost-effective opportunities.
• Video Content Dominance: Continued shift toward video may affect production and advertising costs.
• E-commerce Integration: Enhanced shopping features may improve conversion rates and justify higher costs.
• Global Market Expansion: Emerging markets may offer cost-effective advertising opportunities.
• Regulatory Changes: Privacy regulations may continue affecting targeting capabilities and costs.
• Economic Uncertainty: Market conditions may create both challenges and opportunities for cost optimization.
Conclusion
Managing Facebook advertising cost effectively requires balancing multiple variables while maintaining focus on business objectives rather than simply minimizing expenses. Success comes from continuous testing, data-driven optimization, and strategic thinking about long-term customer value rather than just reducing costs.
The key lies in creating compelling content, understanding your audience deeply, and maintaining a comprehensive approach to campaign optimization. For businesses seeking to maximize their Facebook advertising ROI, partnering with experienced digital marketing professionals can make a significant difference.
At Fast Digital 360, we specialize in transforming complex advertising challenges into measurable success through our comprehensive PPC management and social media advertising services with over 10+ years of proven expertise in optimizing Facebook advertising costs.
Frequently Asked Question
1. Which platform has the lowest CPC?
YouTube offers the lowest CPC ($0.10–$0.30), making it cost-effective for video campaigns.
2. Why is LinkedIn advertising more expensive?
LinkedIn focuses on B2B professionals, so while costs are higher, lead quality is usually better.
3. Which platform is best for e-commerce brands?
Instagram and Pinterest are ideal for e-commerce and lifestyle products due to their visual-first approach.
4. Does competition level affect ad cost?
Yes, industries with higher competition (like finance or real estate) face higher CPC and CPM.